Prometheus
Prometheus offers visualization and insight into Kubernetes operations. For Zenko, it aggregates metrics exposed by Kubernetes pods that have been configured to yield Prometheus-readable data.
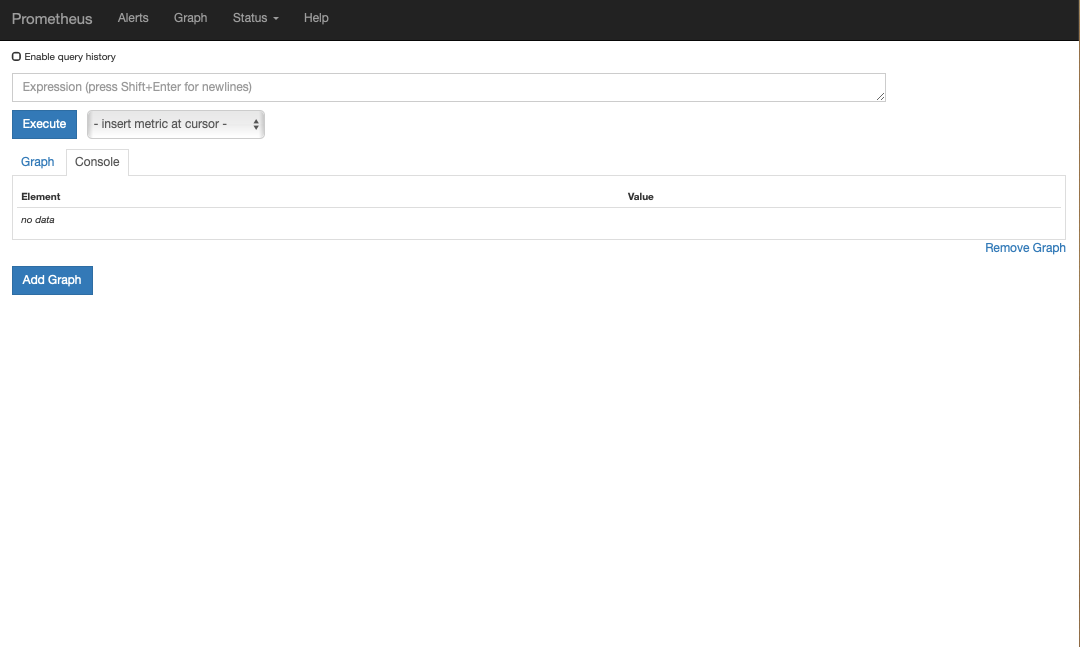
Prometheus ships with MetalK8s. Access to Prometheus is similar to that for other dashboard services. Open http://localhost:8001/api/v1/namespaces/kube-ops/services/kube-prometheus:http/proxy/graph in your browser. If you are configured to see the other dashboards, the Prometheus dashboard displays:
If you use a different Kubernetes implementation than MetalK8s, you will have to install your own Prometheus instance to use this feature.


