Grafana
Grafana provides a “dashboard of dashboards” that offers deep insight into ongoing operations. Installing the Zenko stack gives you access to an “application-level” Grafana, which provides information about CloudServer operations. Installing Zenko with MetalK8s also provides access to “platform-level” Grafana, which provides information about cluster operations.
Both require some setup, detailed in the installation guide, which ships with the Zenko repository.
Application-Level Grafana
Deployed with all Zenko instances, application-level Grafana provides insight into CloudServer operation.
Configuration
Operating application-level Grafana requires modifications to options.yaml, and may require further configurations.
To enable application-level Grafana:
Open the options.yaml file for editing. Though it may be located anywhere in your Zenko directory, if you followed the installation instructions closely, you will find it at Zenko/kubernetes/options.yaml.
Add the following block to options.yaml:
grafana:
  ingress:
    enabled: true
    hosts:
      - grafana.local
    tls:
      - secretName: zenko-tls
        hosts:
          - grafana.local
  adminUser: admin
  adminPassword: strongpassword
Important
Storing passwords in a plain text configuration file is not a best security practice. For higher security deployment, either allow Grafana to set its own passwords or have password secrets managed by a credentials management service, such as an LDAP secrets manager. This requires adding an LDAP configuration block to options.yaml, which exceeds scope for this documentation. If you allow Grafana to set its own credentials using the default configuration, the Grafana credentials will be overwritten on every Helm upgrade command.
Upgrade Zenko. From Zenko/kubernetes/zenko, enter:
$ helm upgrade my-zenko -f options.yaml .
If you did not configure the adminUser and adminPassword parameters in the previous step, Helm wipes the old Grafana instance and creates a new one. Grafana generates new admin credentials automatically. The default login is “admin.” To obtain the admin password from such a “default” installation, run the following command from the command line, substituting the name of your Zenko instance for
<my-zenko>:$ echo $(kubectl get secret <my-zenko>-grafana -o "jsonpath={.data['admin-password']}" | base64 --decode) Gcym51zKQG8PSDD2B7ch9h8cXFIu8xalmIQfdXkd
Operation
Once your system and server are properly configured, access application-level Grafana at http://grafana.local/login.
The Grafana login page displays:
Enter the admin identity and the admin password as described in the previous section.
The Grafana dashboard displays:
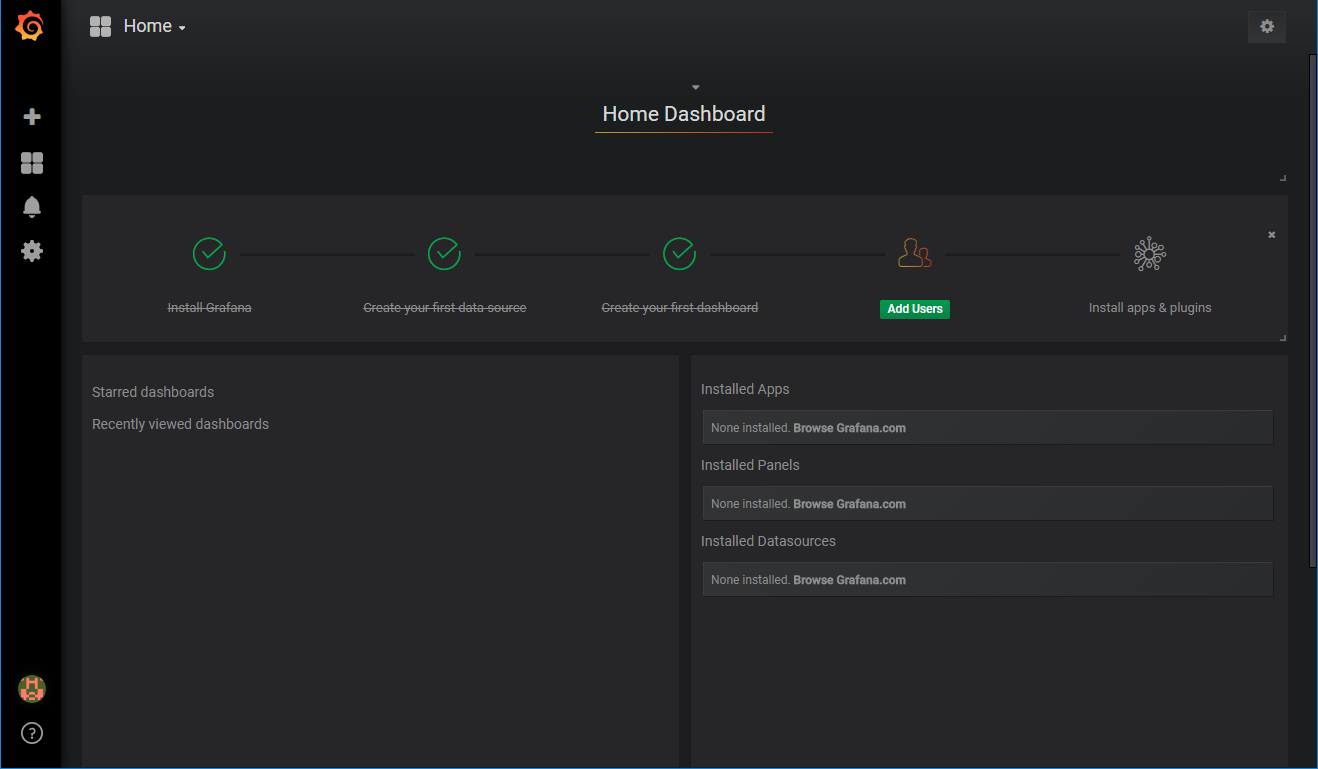
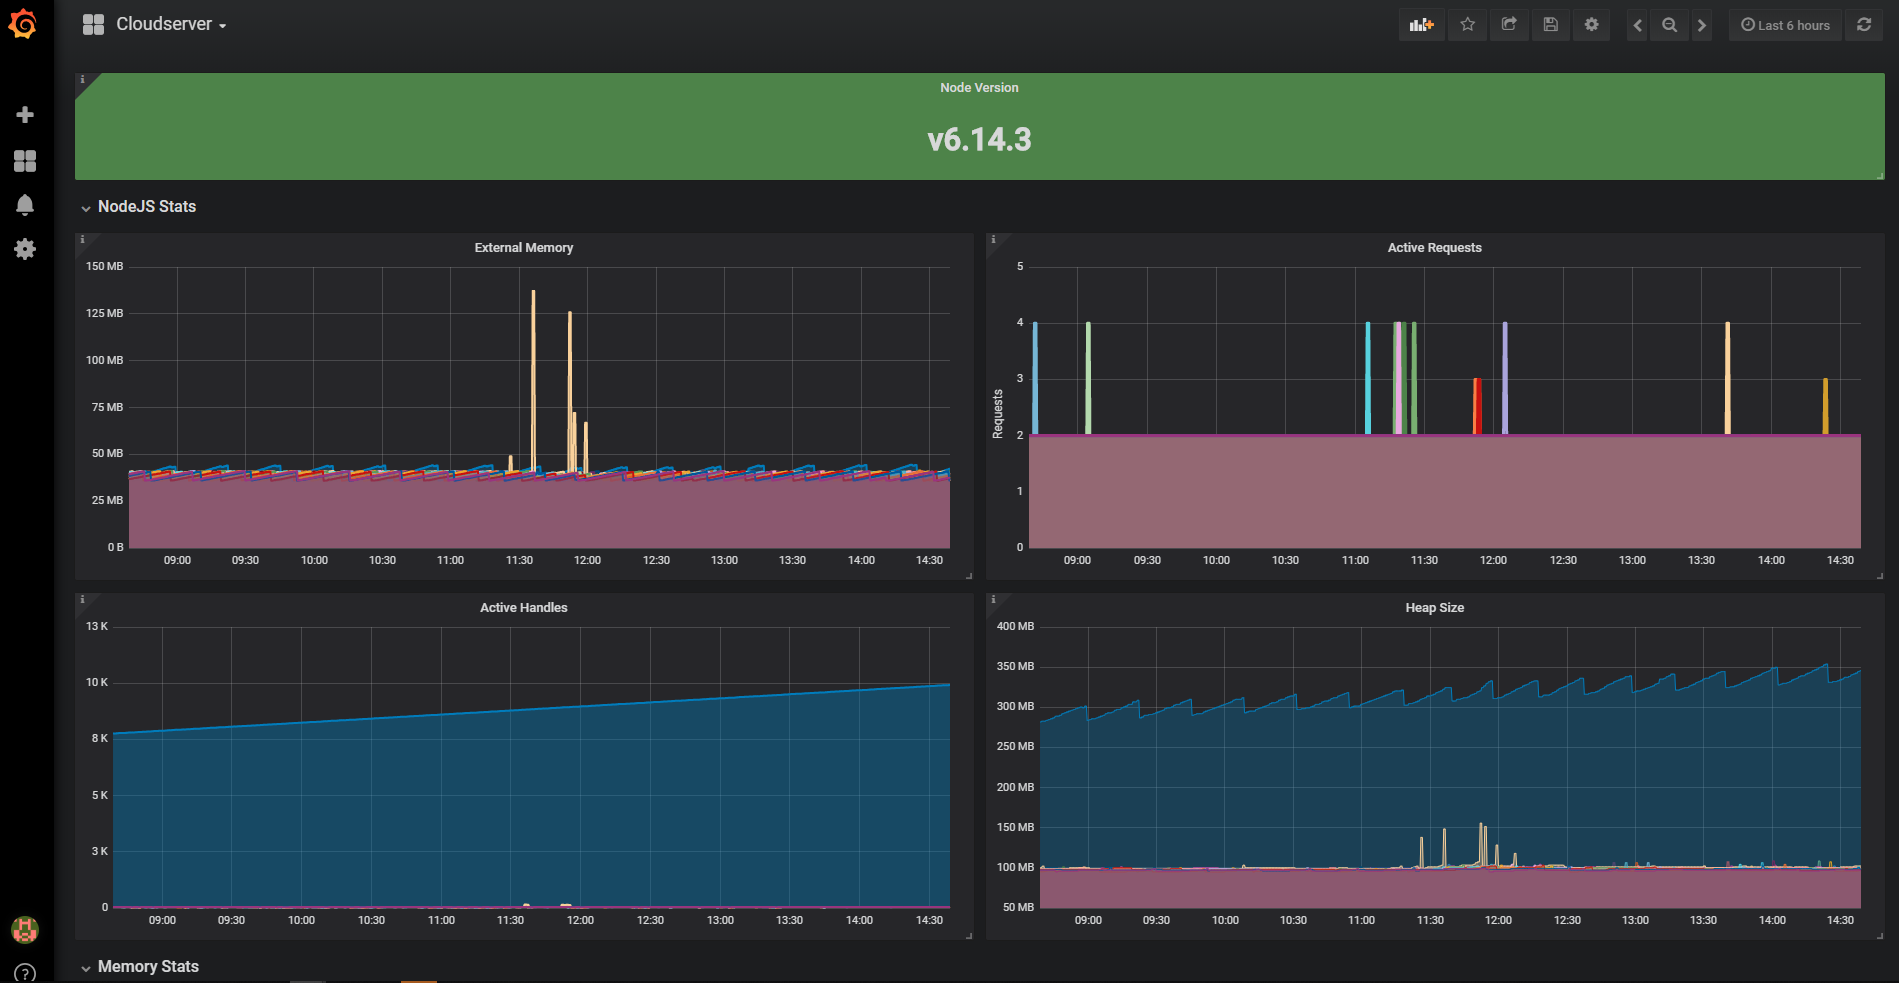
From the Home Dashboard, you can Add Users, Install apps and plugins, or click through to the Cloudserver dashboard.
Troubleshooting
You don’t see the Grafana login page
Possible reasons:
Connectivity
Make sure your browser can access and resolve the IP address (i.e., that you’re in the same network/VPN as your cluster), that kubectl proxy is running between your local machine and the server, and that the server’s Ingress controller is configured and running.
Grafana server is not set in /etc/hosts/
In a managed namespace, the paths to zenko.local and grafana.local should resolve successfully without changes to /etc/hosts in the local machine. However, in test environments, this resolution may not be provided. Check that your local machine has the correct server IP address set in /etc/hosts (c:\windows\System32\drivers\etc\hosts for Windows machines). If not, add the following line to /etc/hosts, substituting the IP address for the cluster on which you are operating Zenko and Grafana:
10.1.1.1 zenko.local grafana.local
Ingress is not set.
Run:
$ helm upgrade <my-zenko> /path/to/zenko\
--set grafana.ingress.enabled=true\
--set grafana.ingress.hosts[0]=grafana.local
This command may rewrite your Grafana credentials. See the note above.
Grafana is not running on the server:
$ kubectl get pods | grep grafana
Your admin password is rejected
If you’re sure you have entered the admin password correctly (as produced by the echo command above), run:
$ kubectl get pods | grep grafana

my-zenko-grafana-5dbf57f648-wbnkg               3/3       Running   0          7m
Copy the first part of the result and restart Grafana on the server with:
$ kubectl delete pod my-zenko-grafana-5dbf57f648-wbnkg
Your particular running instance will, of course, have a different working name and hashes.
Give Kubernetes a minute or so to bring the Grafana pod back up.
When
kubectl get podsshows the new Grafana instance running and stable, retry the login.
Platform-Level Grafana
Deployed with MetalK8s, Grafana provides the following views of Zenko and Kubernetes services:
- Deployment
- ElasticSearch
- etcd
- Kubernetes Capacity Planning
- Kubernetes Cluster Health
- Kubernetes Cluster Status
- Kubernetes Cluster Control Plane Status
- Kubernetes Resource Requests
- Node Exporter Full
- Nodes
- Pods
- Prometheus 2.0 Stats
- StatefulSet
Access platform-level Grafana using this URL: http://localhost:8001/api/v1/namespaces/kube-ops/services/kube-prometheus-grafana:http/proxy/?orgId=1


